 auzui
auzui
◧
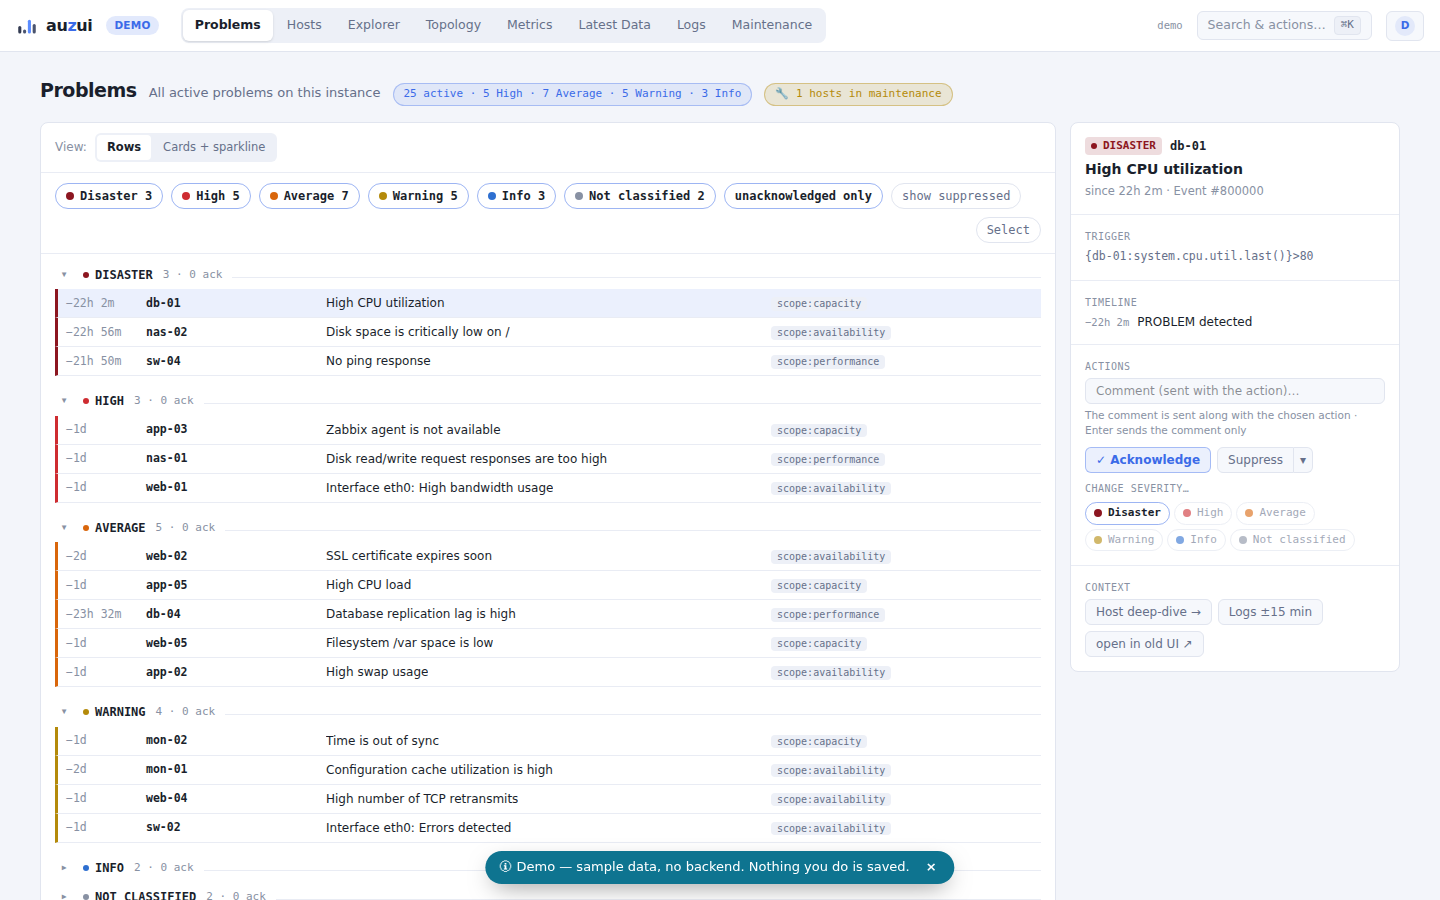
Problems as a live triage board
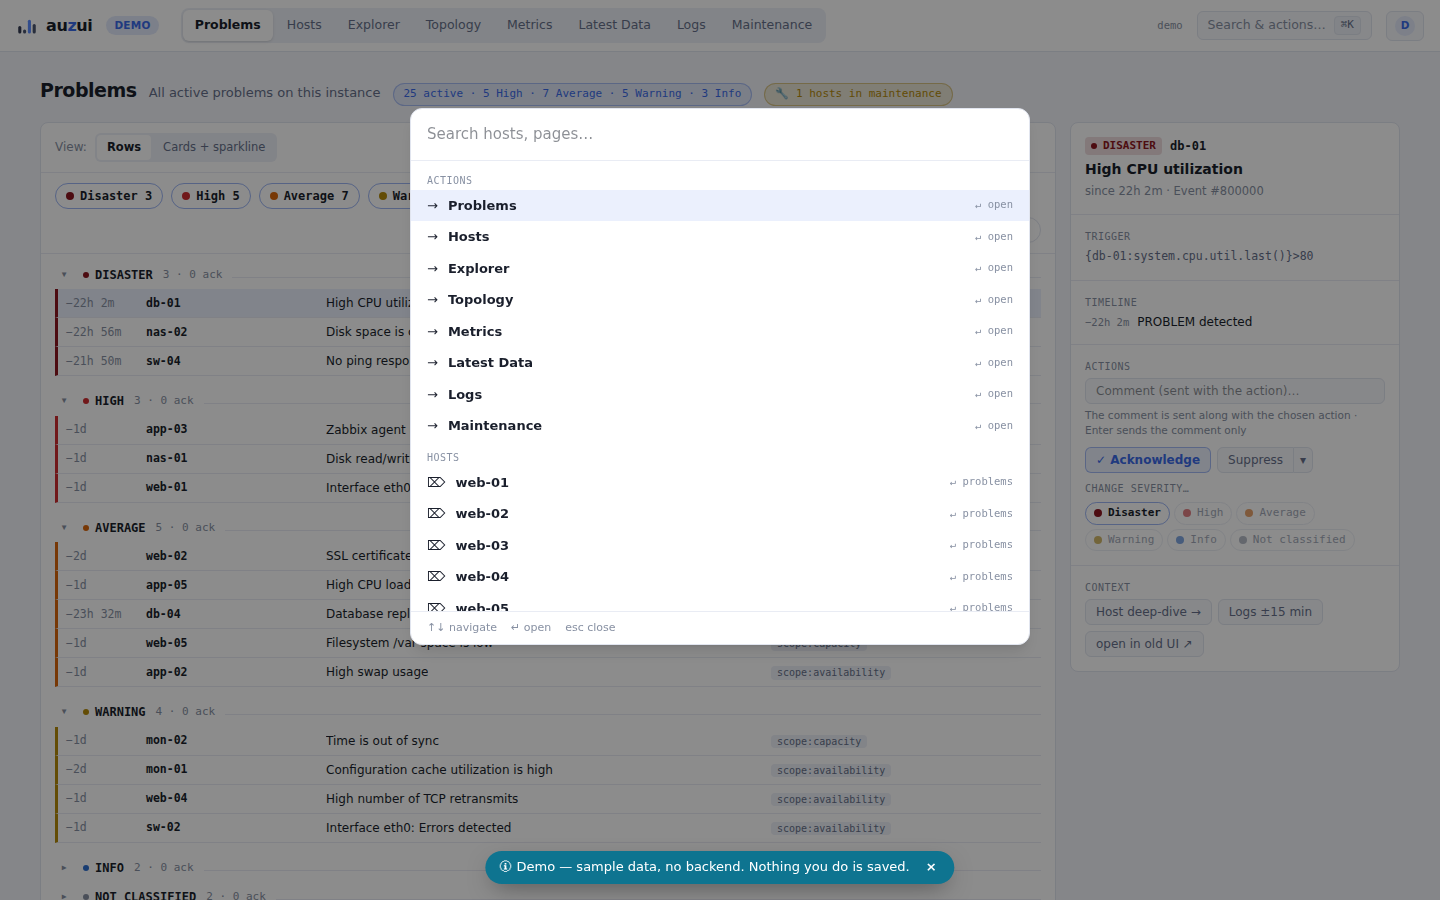
Virtualized list, inline acknowledge/comment without modal cascades, severity filter chips, bulk actions, and a URL-addressable side panel instead of a popup — filters are shareable links.
auzui is a modern, dark-mode-first monitoring single-page application that runs next to your existing Zabbix web UI — not instead of it. Configuration stays in classic Zabbix; auzui rebuilds the monitoring workflows that benefit most from a fast, dense, zero-config interface.
auzui derives as much as it can automatically from what Zabbix already knows — item tags, units, templates, trigger expressions, LLD, inventory — instead of asking operators to configure dashboards, panels, or thresholds by hand.
Virtualized list, inline acknowledge/comment without modal cascades, severity filter chips, bulk actions, and a URL-addressable side panel instead of a popup — filters are shareable links.
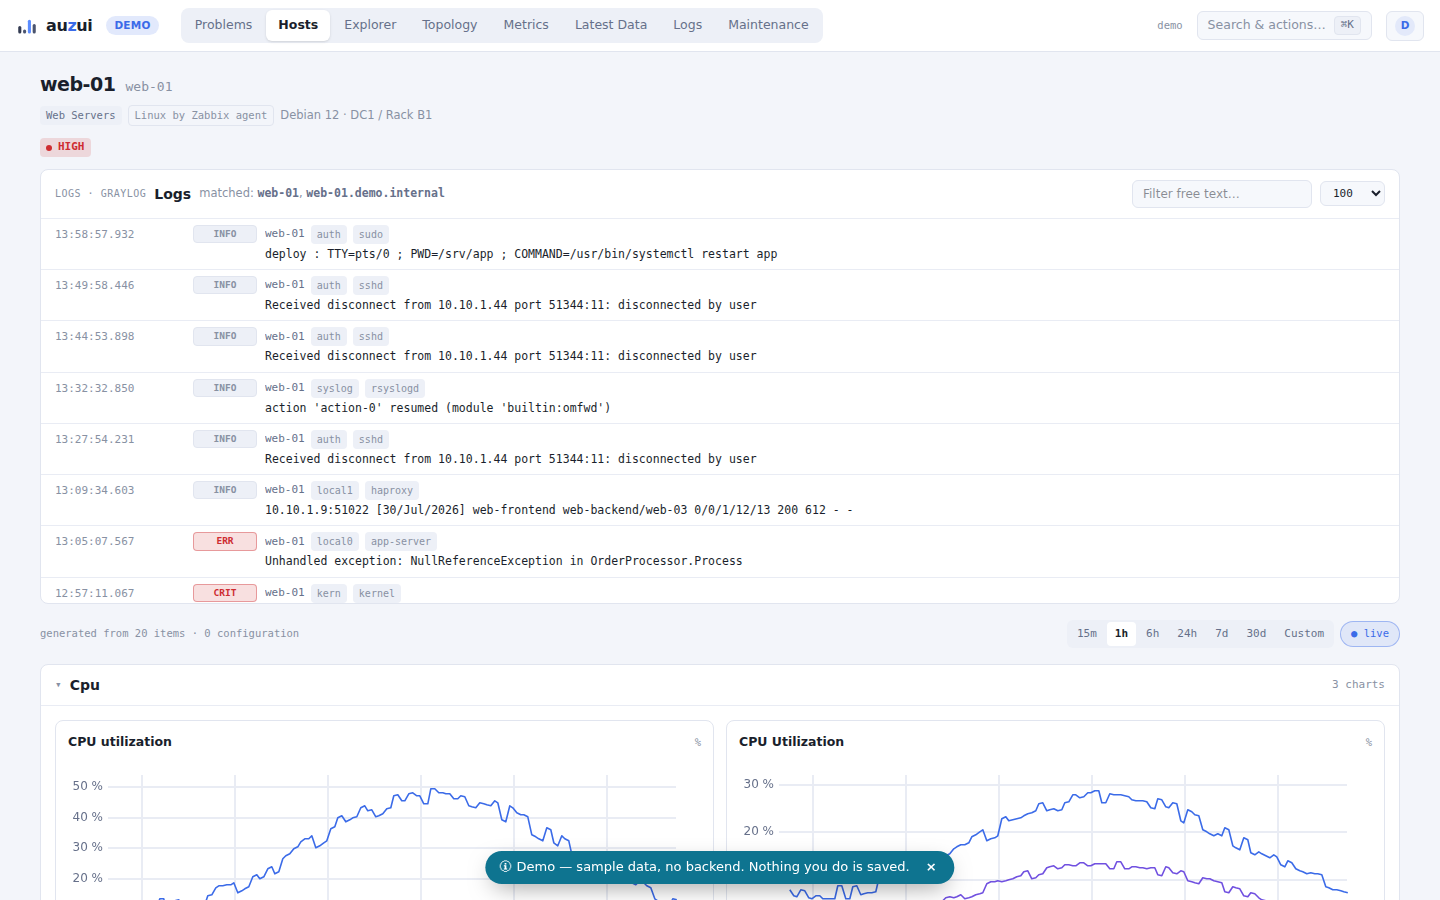
A fully generated per-host dashboard: sections by component class, trigger thresholds rendered as chart zones, an interface/port matrix, storage & certificate forecasts, 7-day ghost lines — with zero manual configuration.
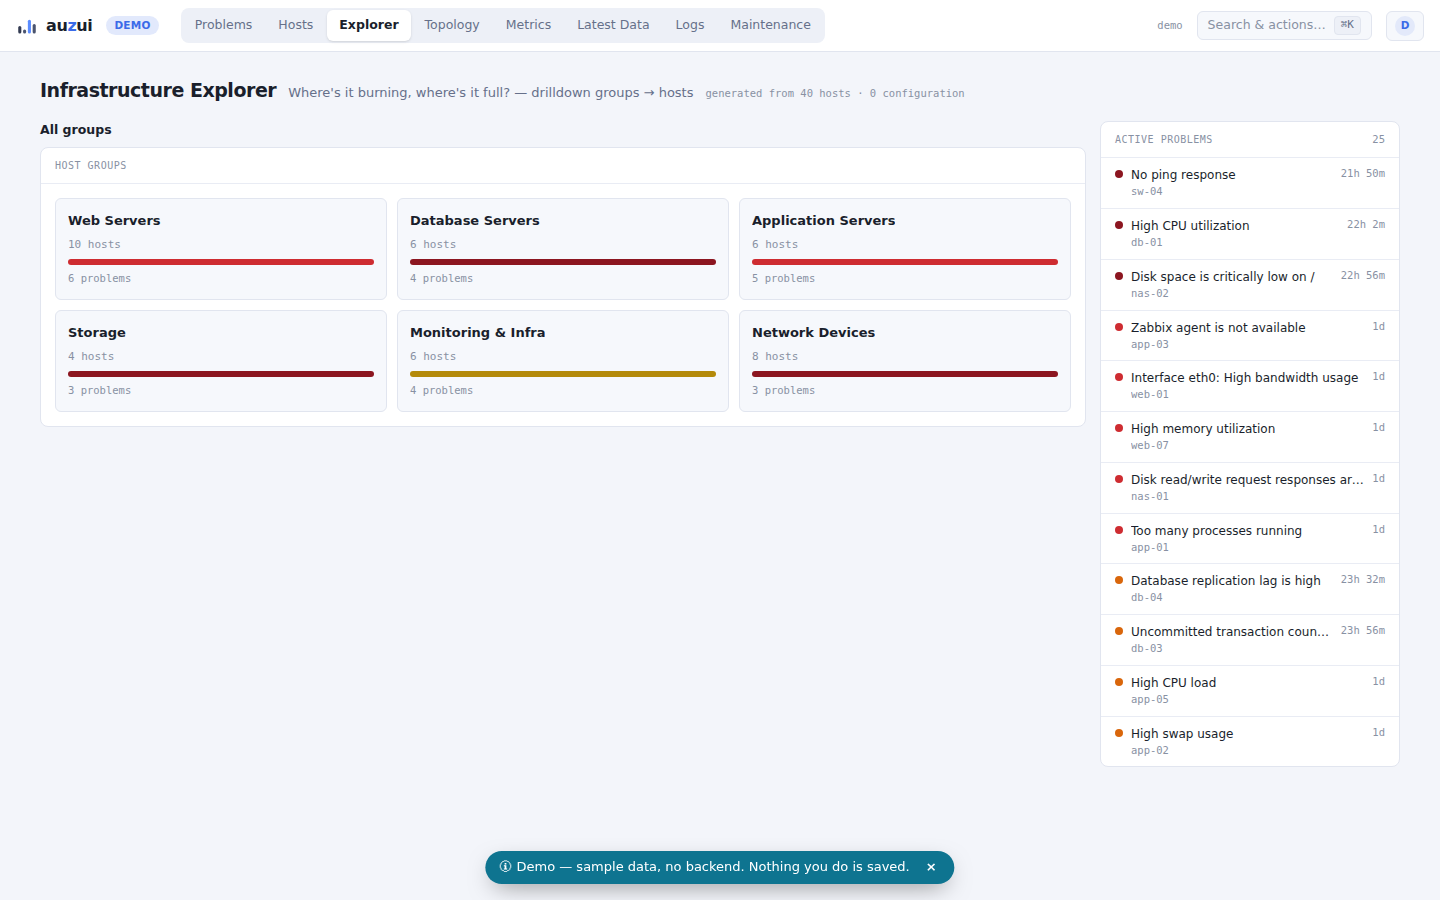
Heatmap drill-down from host groups → host tiles → component tiles → item, colored by status or utilization, with a "top movers" sidebar at every level.
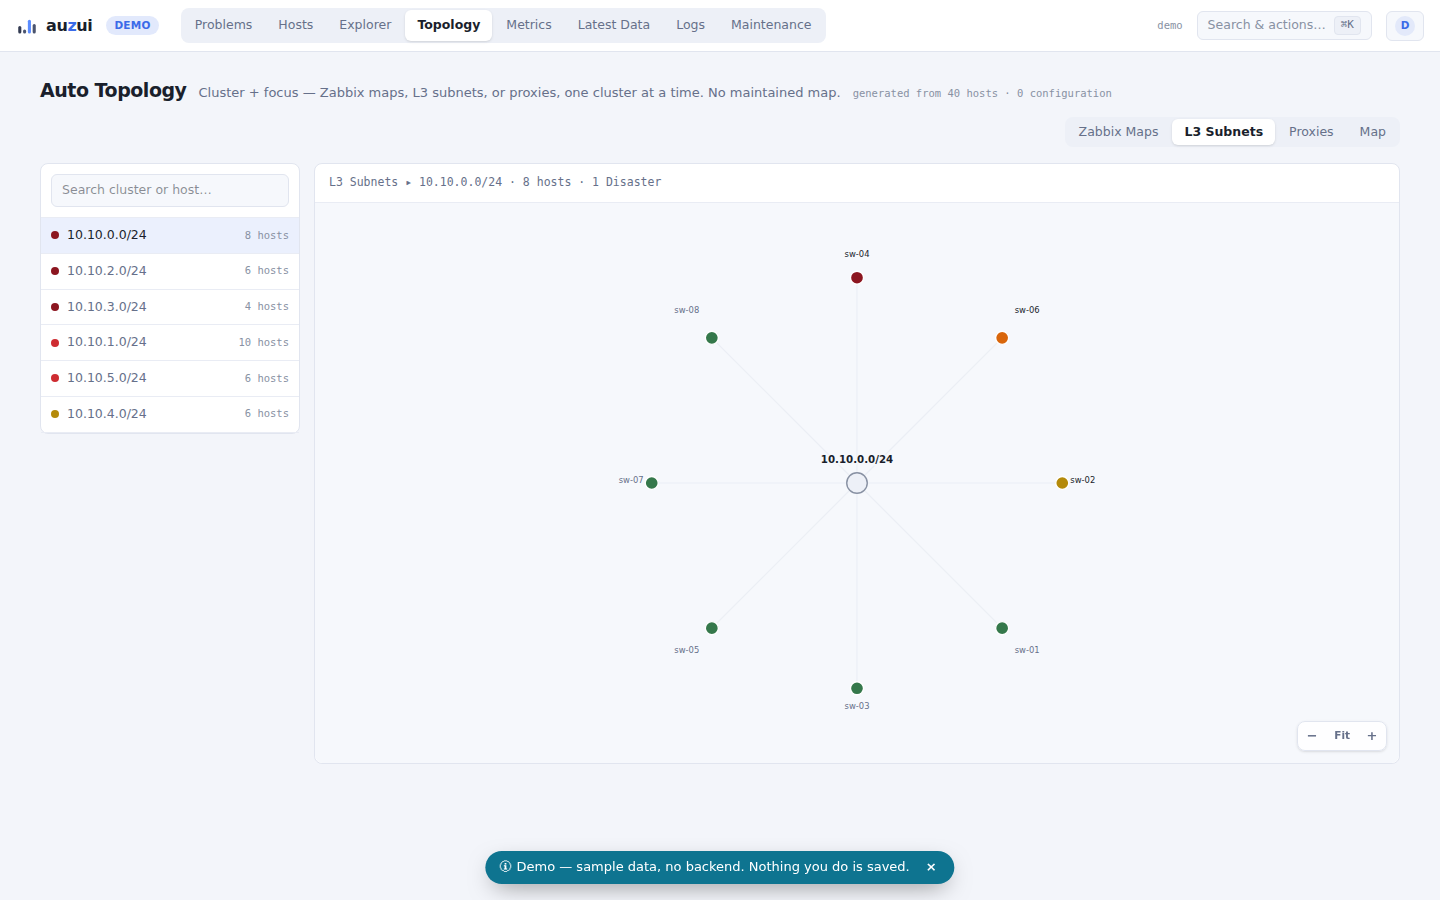
A force-directed dependency graph built from trigger dependencies, LLDP/CDP neighbors, shared subnets, and statistical event correlation — each edge tagged with its evidence layer and confidence.
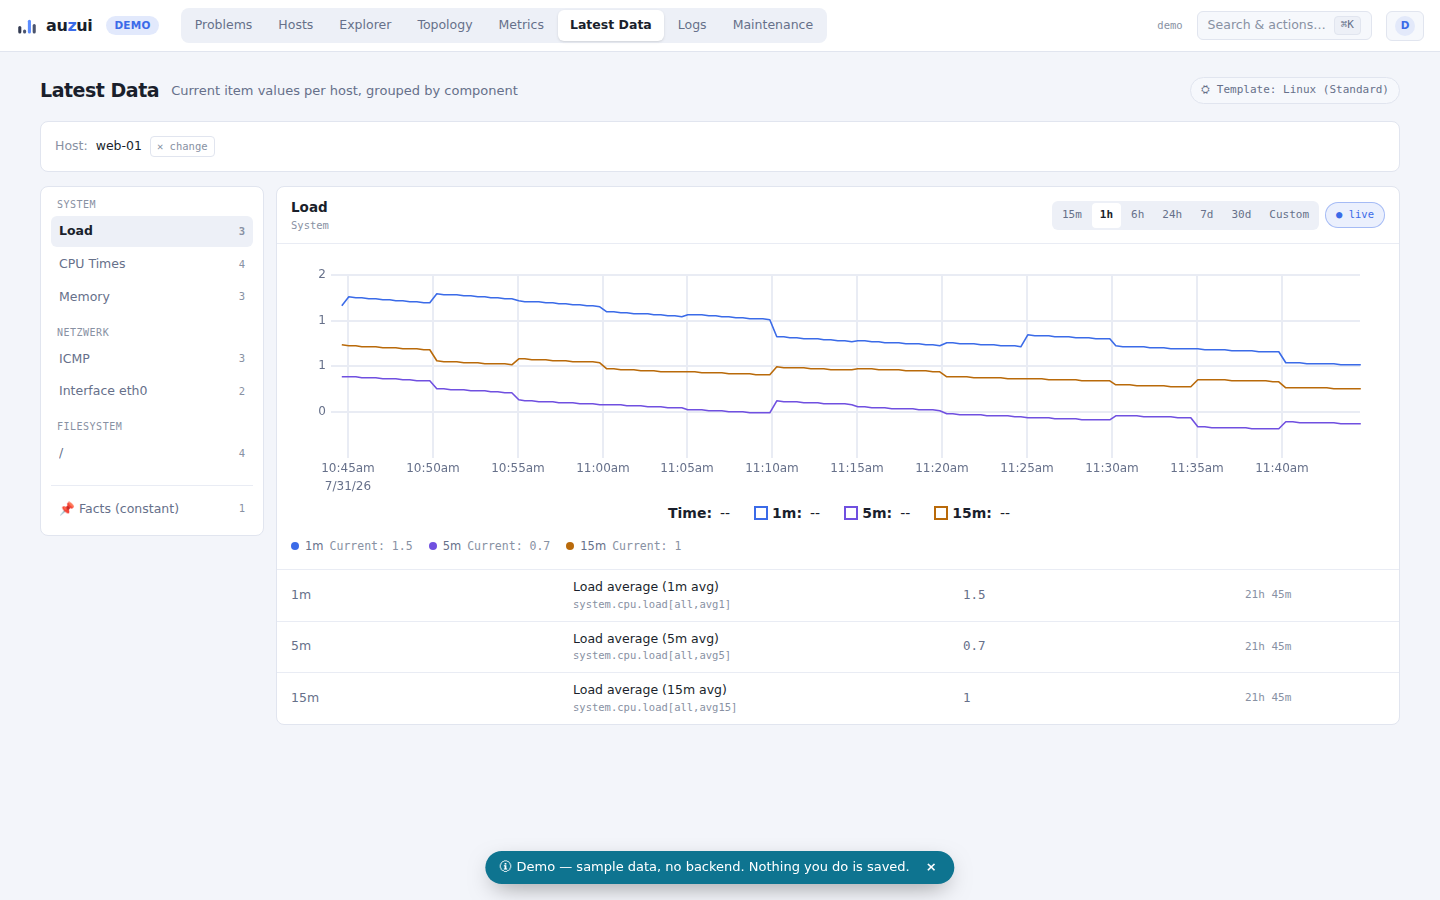
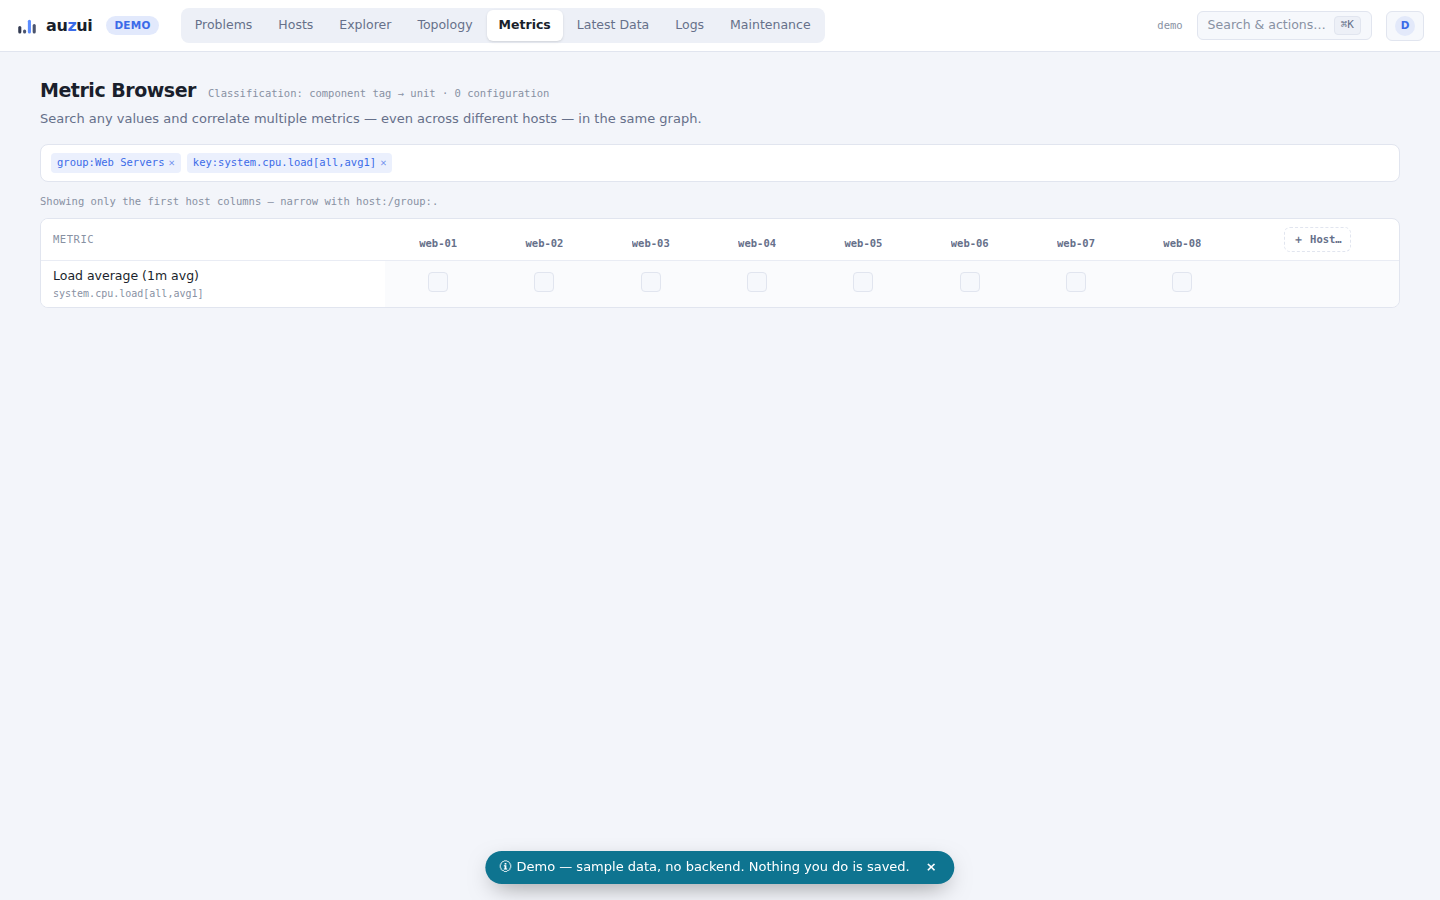
Faceted search across every item (component tag, unit, template, group), a small-multiples wall sortable by deviation from baseline, with multi-select overlay comparison across hosts.
Global search over hosts/items/triggers/dashboards plus actions ("Ack problem…", "Go to host…"), replacing deep menu navigation.
High information density, consistent severity color semantics, and skeleton loading instead of spinners — built for daily on-call use.
Route time-series through a Flux aggregateWindow
query via auzui-gateway — server-side
downsampling for long ranges and dense multi-item
dashboards, from an effluence export.
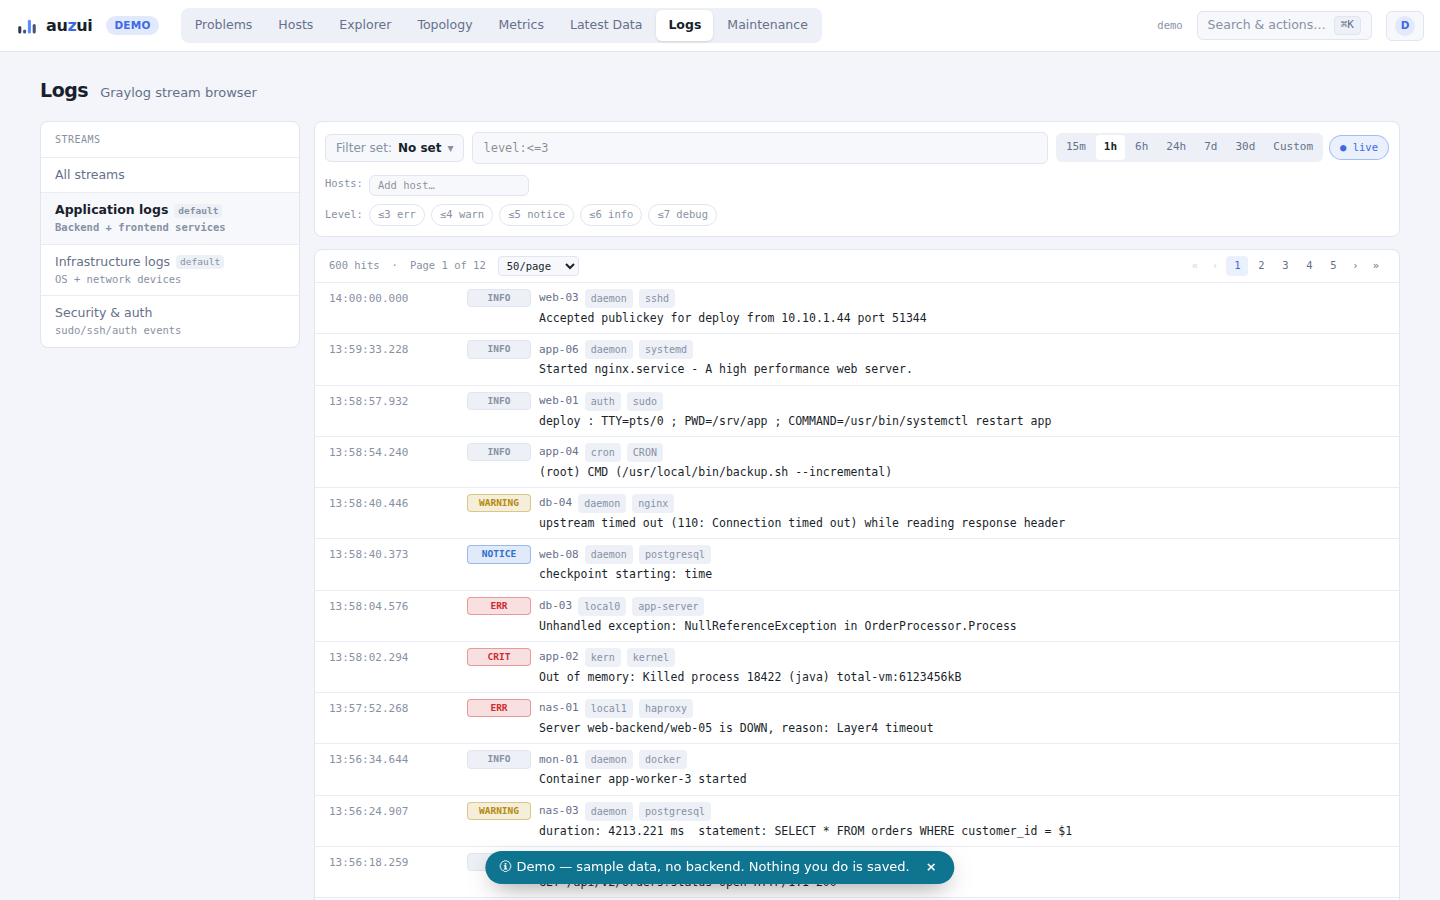
A stream browser and host-scoped log panel synced to the same time range as the charts — entirely feature-gated, no Graylog configured means the panel simply doesn't appear.
Problems triage, host dashboards, exploration, topology, metrics, and logs.
One container — the auzui-gateway (FastAPI) and
the built SPA. Only ZABBIX_API_URL is required;
InfluxDB and Graylog are optional and feature-gated. Full
reference:
docs/deployment.md.
services:
  auzui:
    image: ghcr.io/cygnusnetworks/auzui:latest
    restart: unless-stopped
    ports:
      - "127.0.0.1:8080:8000"
    environment:
      # Required: the Zabbix JSON-RPC endpoint for permission checks.
      ZABBIX_API_URL: "https://zabbix.example.com/api_jsonrpc.php"

      # Optional: InfluxDB fast path for time-series (all three enable it).
      # INFLUX_URL: "http://influxdb:8086"
      # INFLUX_TOKEN: "changeme"
      # INFLUX_ORG: "example.com"

      # Optional: Graylog log panels (both enable it).
      # GRAYLOG_URL: "https://graylog.example.com/api"
      # GRAYLOG_TOKEN: "changeme"
    healthcheck:
      test: ["CMD", "curl", "-fs", "http://localhost:8000/health"]
      interval: 30s
      timeout: 5s
retries: 3The full monitoring UI in your browser — mock data only, nothing is saved, no Zabbix instance required.